Extending calculation groups in Power BI with unstructured data (targets, budgets etc.)
- Brunner_BI

- 18. Dez. 2021
- 2 Min. Lesezeit
Calculation groups in Power BI a lot of times rely on time intelligence calculations.
If you do not know calculation groups yet, read this.
What if we have a calculation group that is fully dynamic (in terms of time/dates) but we have to add some kind of unstructed targets or budgets to it. And what if this calculation group should work with multiple measures and the respective target values?
Let me explain what I mean:
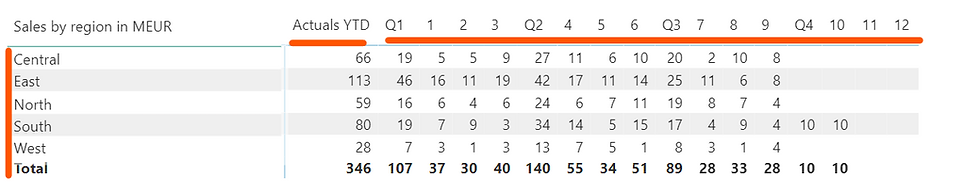
Imagine you have sales data by region, like in this simplified table.
Data fields DAX Measure Time intelligence calculation group
What if we dont only have a sales measure but also profit, COGS, quantity sold or average shipping time and the calculation group should function for all of them?
Whatever measure we drag into the "values" the dax expression works the same, no issues yet!
What if we now have an "unstructured" excel spreadsheet for target, budget or any other values? Imagine that sheet looks something like this.
We did not get any targets for any regions either, only overall targets (e.g. for YTD).

Here I already renamed the last column to "Measure_name" since this will be part of the solution, you can name it however you want of course.
What we want to do now is to extend our calculation group that whenever I use my sales measure it will automatically pull the sales target value from the table above (e.g. 330 million Euros for Sales_YTD)
When I use Profit_YTD it should pull the target value for that and so on...
How do we pull this off?
I am sure there are many solutions, one of them is this:
1) Add a new calculation item to your calculation group (via Tabular Editor) with the following DAX code and name it e.g. "Target_YTD"
    CALCULATE (
        SUM ( Excel_table[Value] ),
        KEEPFILTERS ( Excel_table[Measure_name] = SELECTEDMEASURENAME ()
        )
The function SELECTEDMEASURENAME() comes really handy here since it will filter the value for whatever measure we drag into the calculation group (a target value for it has to exist in our excel table of course) This function is reading the name of the measure we are currently using (documentation).
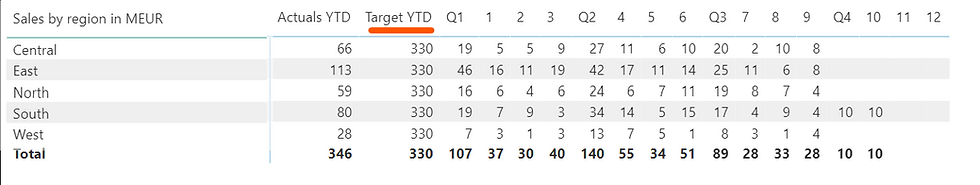
We will end up with this table, the 330 million euros is correct, it does show up for all regions though and that might not be ideal (Power BI cannot differentiate between the regions since there is no link to it)
We have one more trick for you, getting rid of those duplicates.
2) Extend your DAX expression like this
VAR mycalc = CALCULATE (
        SUM ( Excel_table[Value] ),
        KEEPFILTERS ( Excel_table[Measure_name] = SELECTEDMEASURENAME ()
        )

VAR Result = IF( ISINSCOPE(Region[Region]), BLANK(), mycalc )
Return Result
One thing we do here is using variables so our code is easier to read.
But what we are actually doing is using ISINSCOPE() which is a really neat function that checks if a certain column is used in the current context (that is my translation, here is the official documentation)
Now we get this
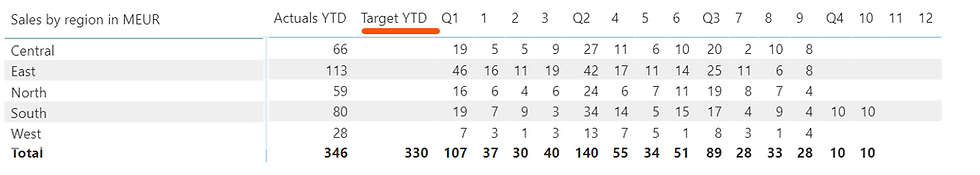
Whatever measure I am dragging into the matrix, it will give me the correct target value, as long as the measure name is matching the measure name in the excel sheet.
I am sure you can use this solution for pulling unstructured data into calculation groups for many other use cases as well.


Kommentare